This is my first blog attempting to explain statistics utilised by data scientists. In this blog, I explain what the terms ‘population’ and ‘sample’ mean, and how sampling is done in a theoretical sense.
Questions to ask:
- What is population and sample?
- What are finite and infinite Populations?
- Why do we need Sample, when we have population?
- What are terms used specific to Population and sample?
- Are there any formula differences to define parameters and samples, like the population and sample mean? Why so?
Population and Sample
- Population refers to the entire data we are studying. Sample, is just a “sample” from the Population.
- Population is the Universal set, and Sample is a subset from Population.
- Population can be thought of a probability model, and the sample is a part of the population.
What are finite and infinite Populations?
- If the target population can be listed/enumerated completely, then this becomes a case of finite population. This makes inferences very easy to make. However, this is not always the case.
- In many cases the data about a population, although finite, can be treated as infinite.
- For example, the heights of adults in America. Although the population is finite, for the purpose of analysis, it is almost impossible to get data of the heights of all the adults in the country.
- Thus, this case can be treated as a case of infinite population.
Why do we need Sample, when we have population?
- In many cases, there is a need to take a sample, when the population is too large.
- For example, if we have to know about the height of all men in India, it is impossible to find the heights of all the men in India, which would be in the millions.
- Hence, we use a sample, and extrapolate the statistics from the sample to talk about the parameters of the population.
- We perform tests on a sample distribution from the population to determine any questions.
Terms used in Population and Sample Measurements
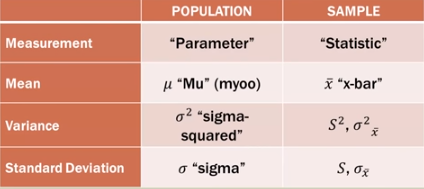
- You can remember this by their first letter -> A Statistic is to Sample as Parameter is to Population.
- The “measurement” is a summary about the population /sample.
- Another thing to note is that in sample statistics, the symbols have a bar/hat on top to distinguish them.
Are there any formula differences to define parameters and samples, like the population and sample mean? Why so?
- There are differences in the metrics, as a sample can never accurately represent the entire population. We can only try our best to do so. Thus, The aim with the formulas for the sample is to be more general to accommodate the differences.
- The differences set up some sort of uncertainty or error by definition of these formulas.
- For example
- \(\sqrt{\frac{\Sigma(X-\mu)}{n}}\) is the population Standard deviation \(\sigma\)
- \(\sqrt{\frac{\Sigma(x-\bar{x})}{n-1}}\) is the sample Standard deviation \(S\)
- This difference of \(n-1\) is to make the variation / standard deviation more wider, to account for more error.
Sampling
Questions to ask:
- What is Systemic Bias? What factors cause this?
- What is the solution to Biases?
- What is Random Sampling? what are its types?
- What is Sampling Variability?
- How do you measure the Sampling variability?
- Relation between sampling variability and sample size?
From population and sample, we learnt that we sample from the population to obtain a sample. While creating samples, we need to take care of systematic bias
- Many times like in polls, sampling is not done in a random manner, and as discussed earlier, it can lead to bias.
- Biases arise due to various factors:
- Selection bias: The sampling procedure systematically includes or excludes part of the population
- Non response: We might not have results/responses and might need further investigation on missing data
- Response bias: In polls and questions asked, people generally have a tendency to respond inaccurately or falsely to questions The most common way to avoid biases is to use a simple random sample. There are other types of random sampling
Random sampling is the sampling in which each entry/row/unit of the population has a non-zero probability to be drawn
- In Simple random sampling, each unit has a equal probability of being drawn.
- Stratified random sampling
- Systemic sampling and many more.
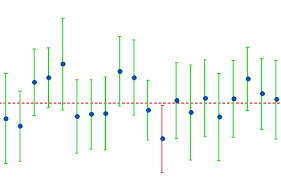
Sampling Variability As explained before, we use samples from the population to extract information about the population. However, it is expected that the results of using one sample would be different than another.
- To measure the average weight of 1000 people, we can use a sample of 50 and calculate their mean weight. Let this sample mean weight be 60 Kg.
- However, if we take another sample, we get an average of 63 Kg.
- As e repeat this with different samples of 50 from 1000, we would obtain different results. These variations is what is referred to as Sampling Variability
In practice, we just have a single sample. Thus, we can find the variance over other samples.
- We have a single sample, which leads to a single sample mean \(\bar{x}\) and the sample standard deviation $s$.
- We now can obtain the variance by using the formula = \(s/\sqrt{n}\), where \(n\) is the sample size
This is because as the sampling size increase, we increase the proportion of samples taken, thus decreases the chances of error. As the sample size increases, the variability of results decreases.
in the above example discussed, if the sample mean is 60Kg, and the standard deviation is 5, then the standard deviation of the sample mean is \(5/\sqrt{50}= 7.07 Kg\). Thus, the weight is \(60\pm7.07Kg\)